Visualizing Simulations
The LangWatch Simulations visualizer enables inspection and analysis of agent test results. The interface provides detailed views of simulation runs, helping you debug agent behavior and collaborate with your team.
Benefits
- See every conversation between your agents and simulated users
- Debug tool calls and agent decisions step-by-step
- Browse, filter, and search through all your simulation runs
- Share and review results with your team
- Spot issues and improve your agents faster
How to Get Started
- Get your API key: Setup page
Tip: Add your
LANGWATCH_API_KEYto your environment right away so your results are visualized automatically. Get your key here. - Set
LANGWATCH_API_KEYin your environment variables - Run your scenario tests as usual
- Open the Simulations Visualizer: https://app.langwatch.ai/@project/simulations
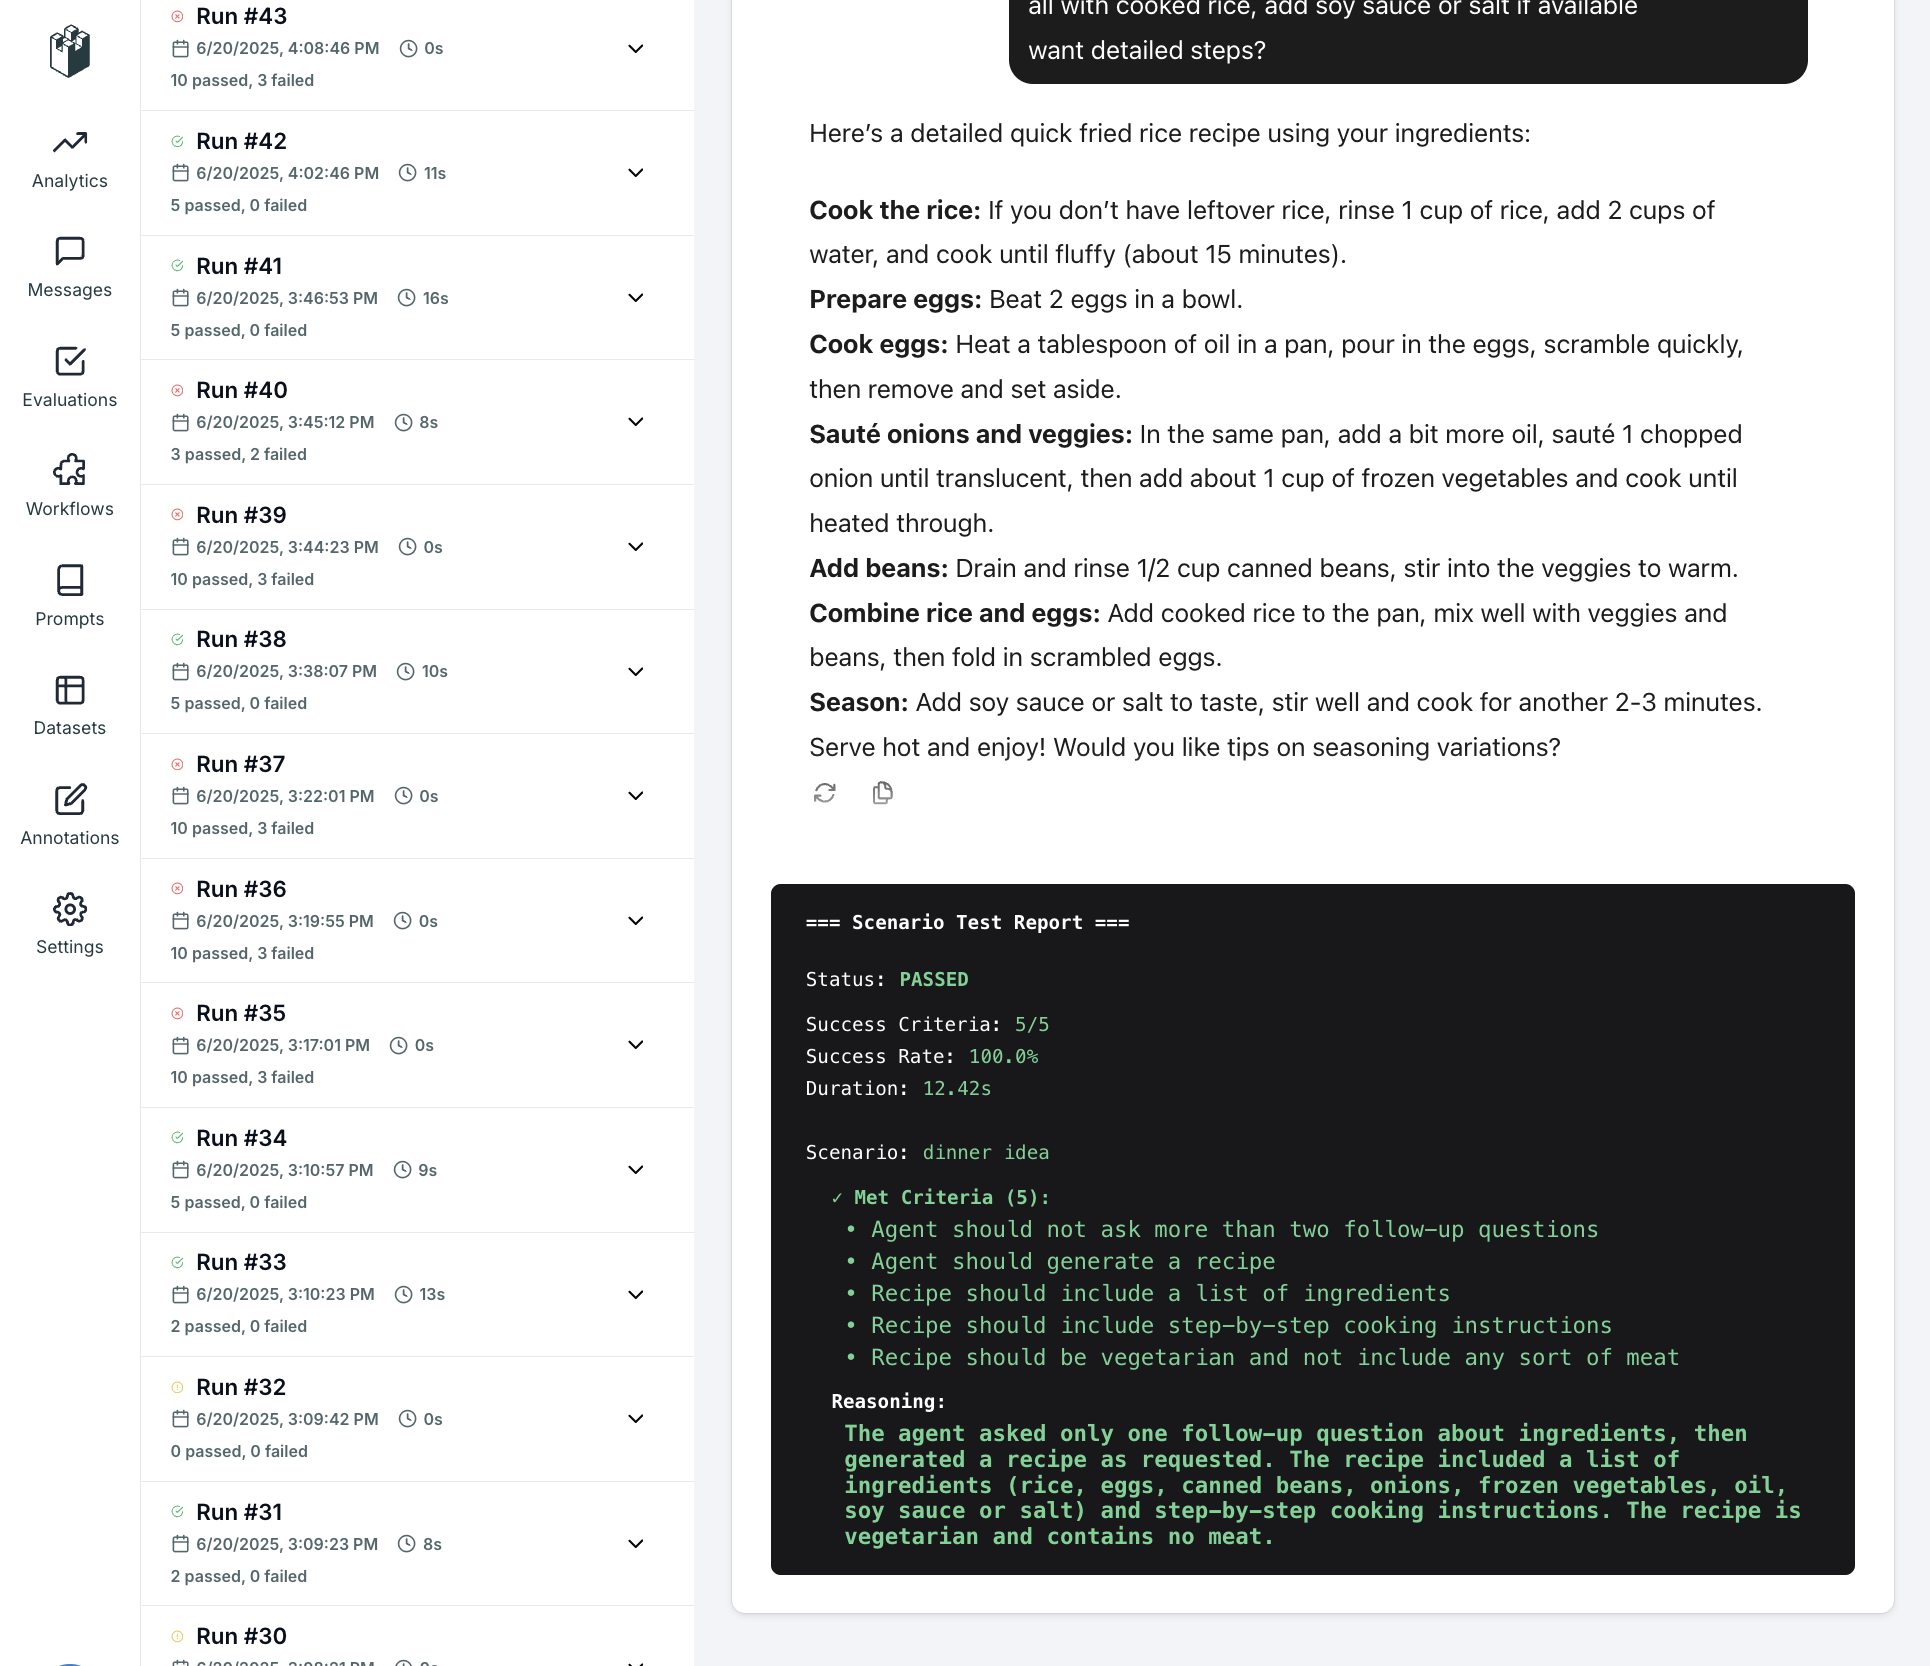
Simulation Results (Detailed View)

- Inspect every message, tool call, and judge evaluation
- See exactly why a scenario passed or failed
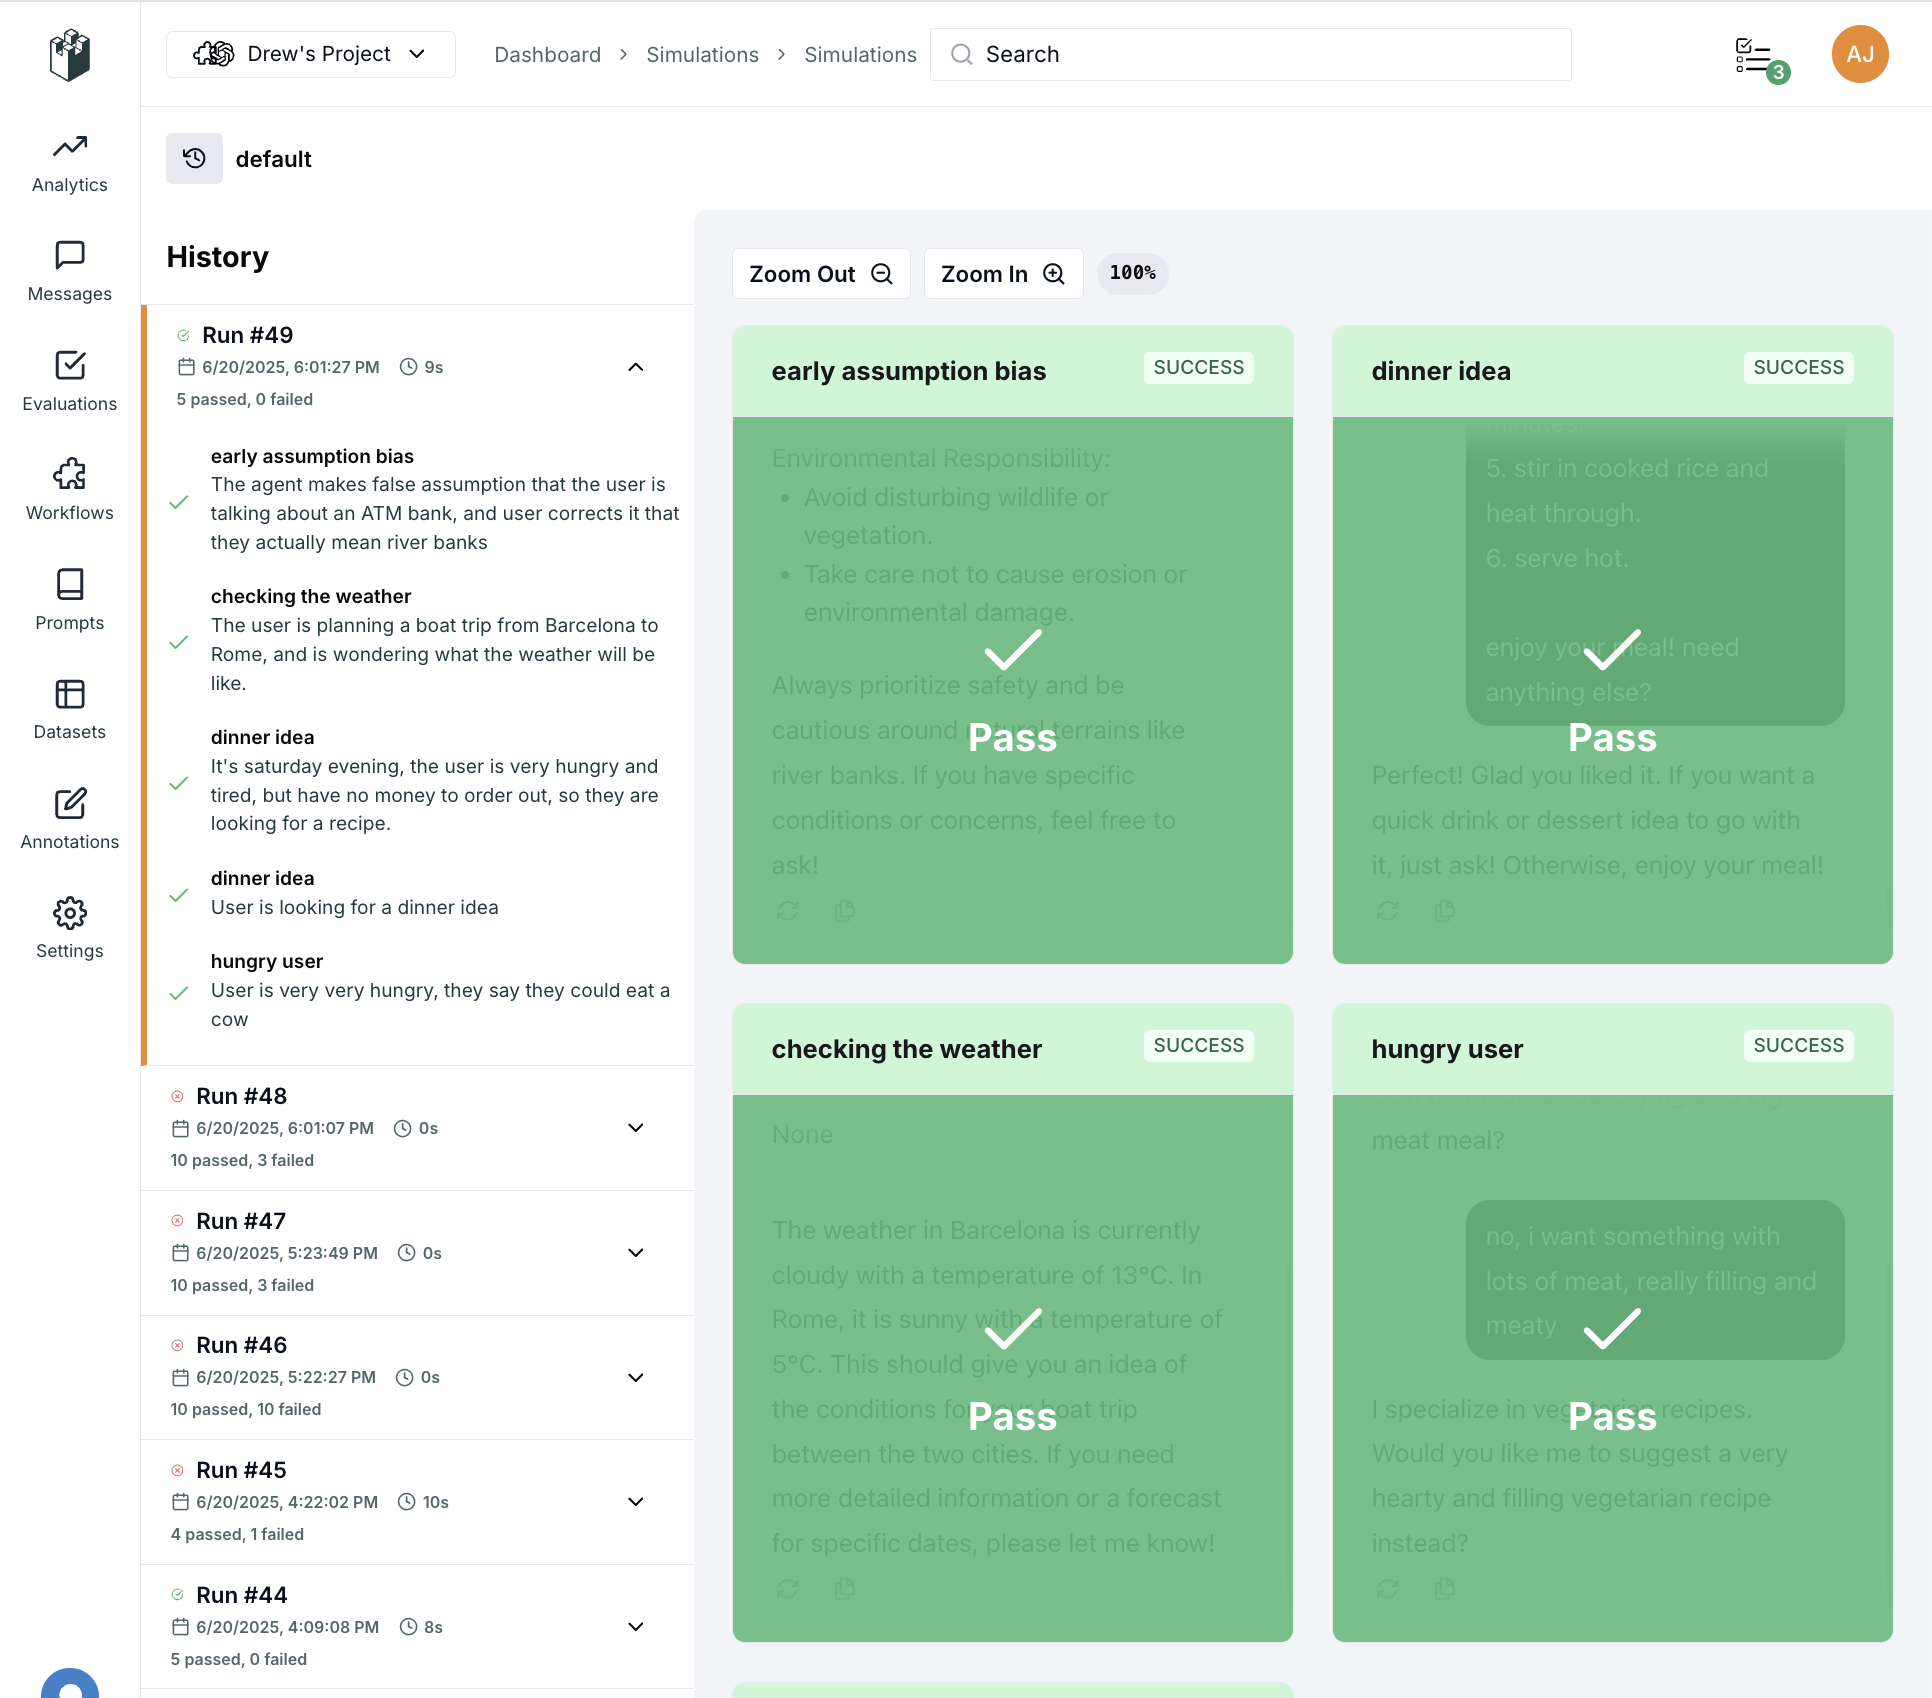
Simulation Set Overview (Dashboard)

- Get a bird's-eye view of all your scenario runs
- Quickly spot patterns, successes, and failures
Help & Tips
Best Practices
- Always set your
LANGWATCH_API_KEYto enable reporting - Use the visualizer after every major change to your agent
- Share links to specific runs with your team for review
FAQ
Q: Do I need a paid plan?
A: The Simulations Visualizer is available to all users!
Q: Where do I get my API key?
A: Get your key here or from the setup screen after signup.
Q: Can I use the visualizer for both Python and JS scenarios?
A: Yes! As long as you set your LANGWATCH_API_KEY, all results are reported and visualized.
